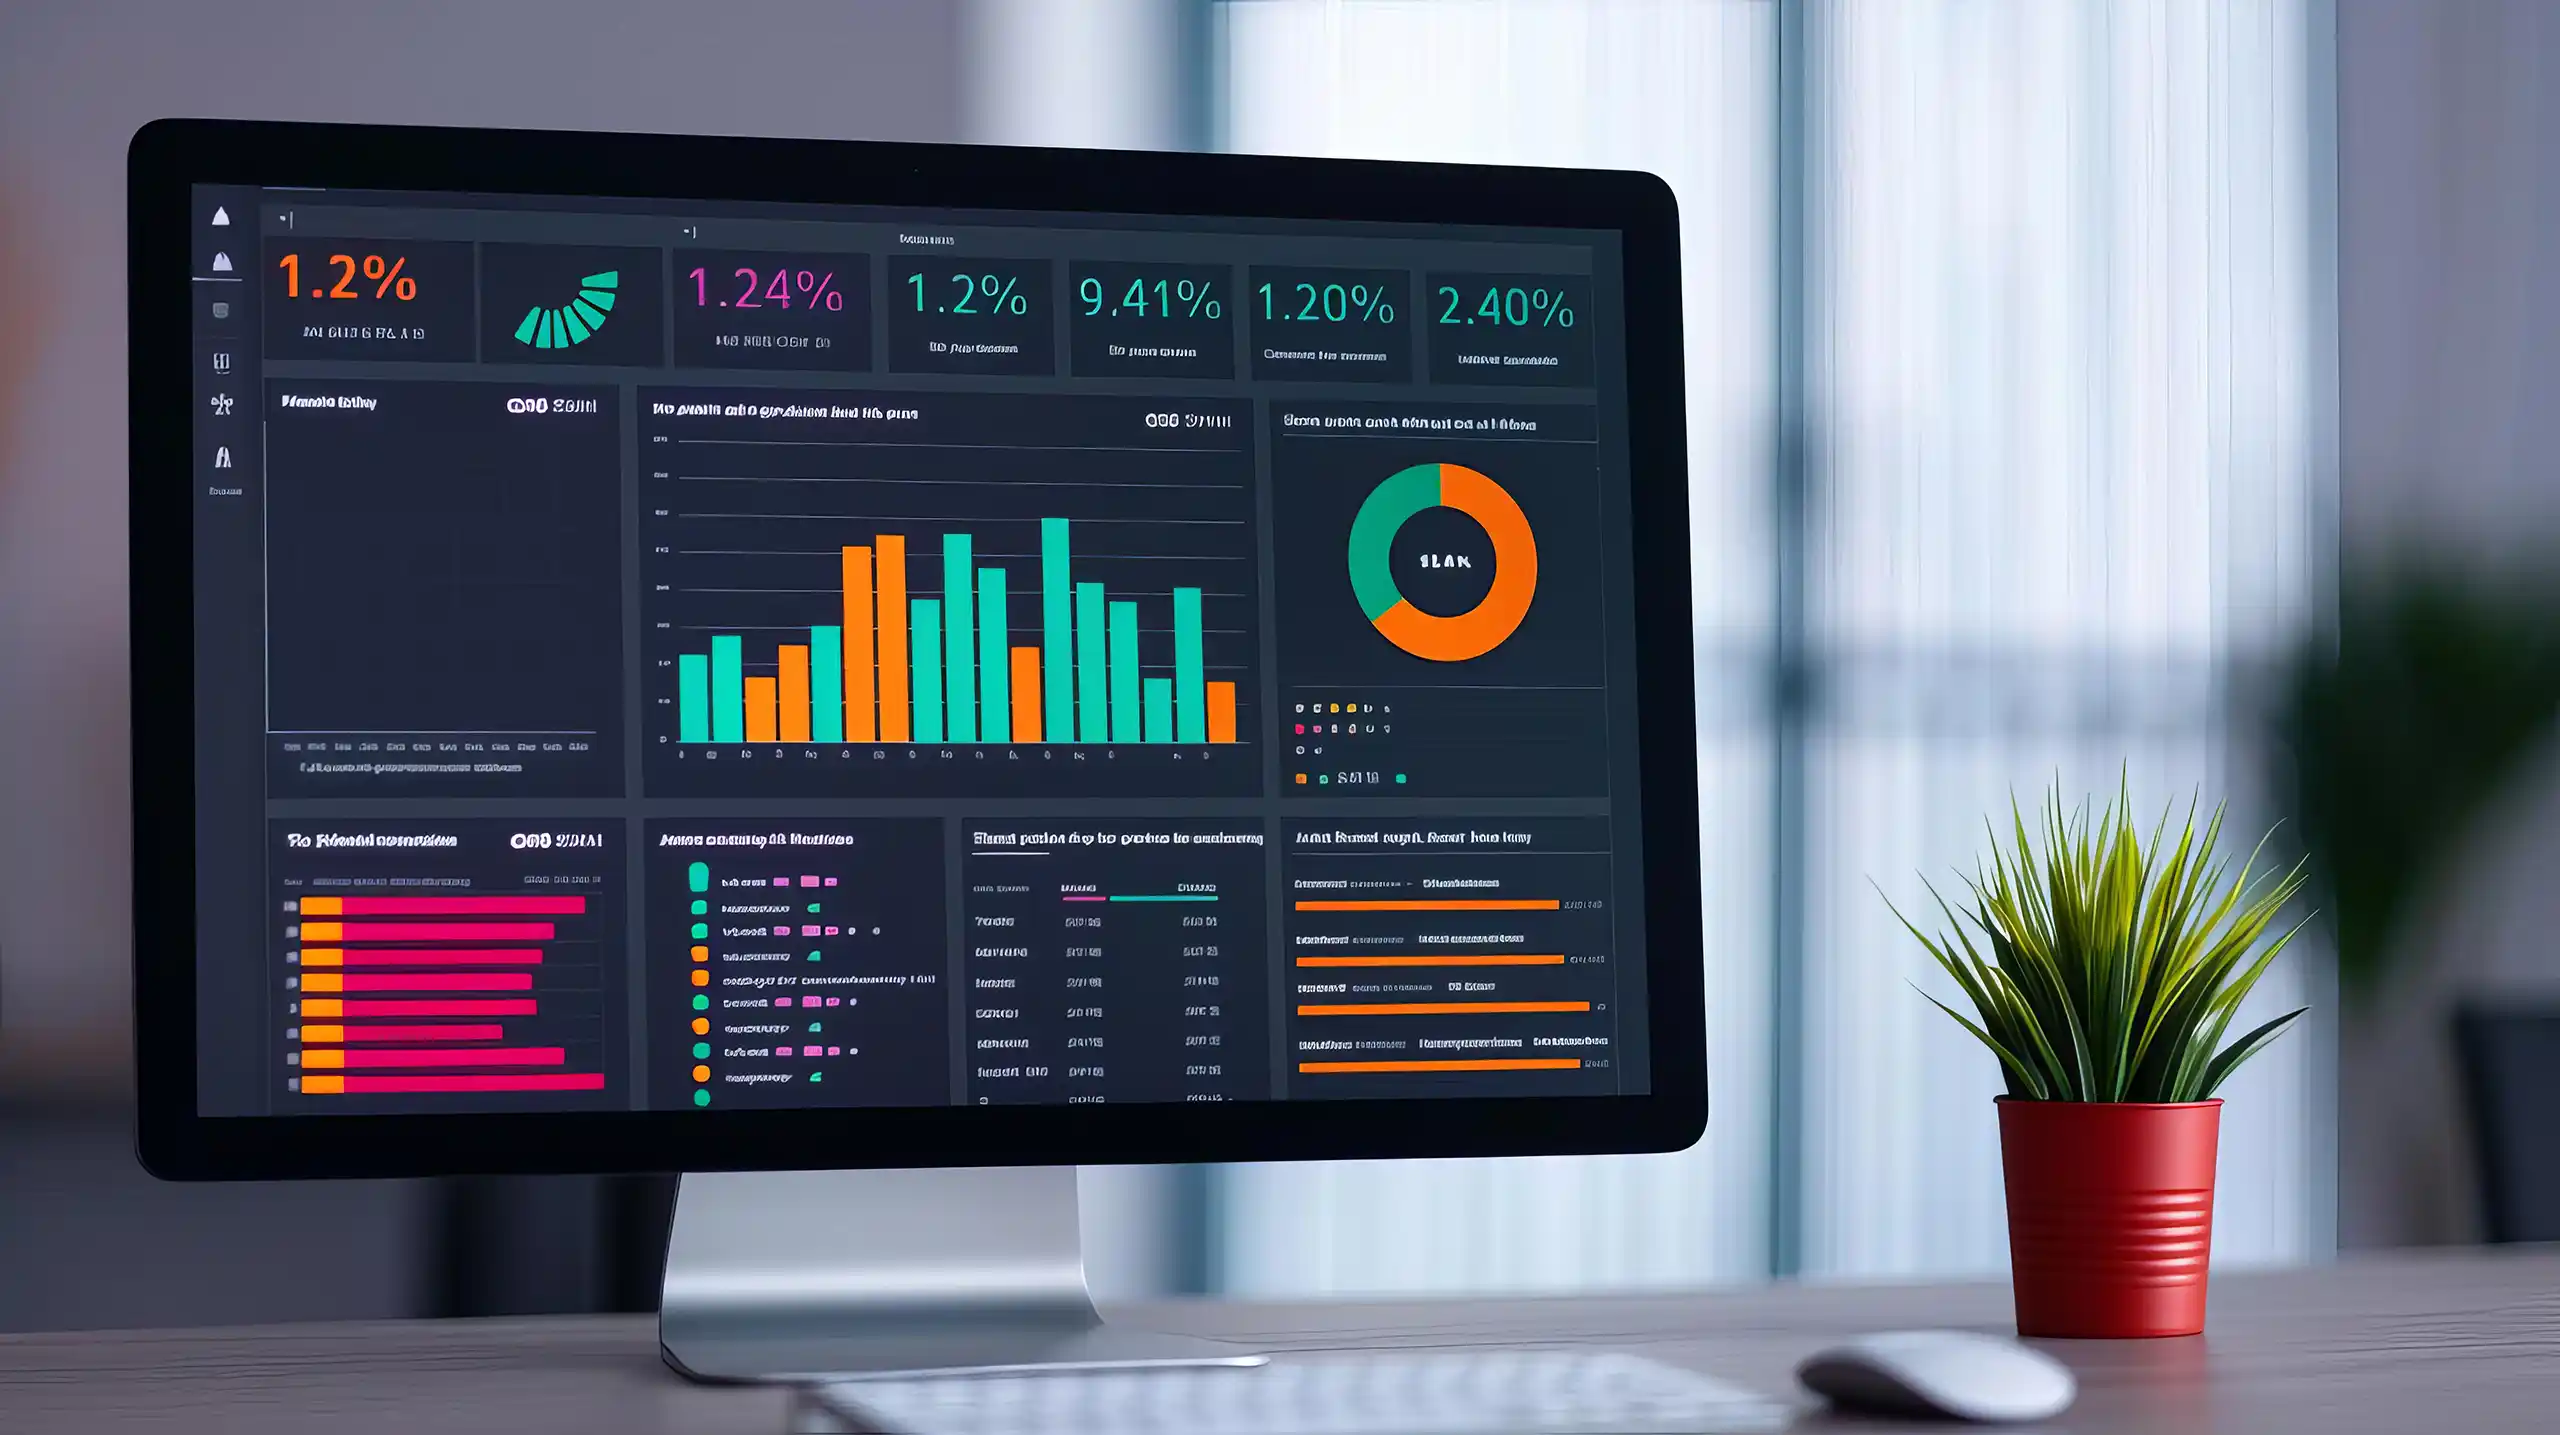
Insights Dashboard
Transform accessibility data into decisions across your entire digital portfolio.
How it works
digital products.
Real-time accessibility tracking
Monitor your digital properties continuously and receive instant alerts for new issues or regressions.

Remediation management
Identify and rank accessibility barriers by severity and user impact, ensuring your team
focuses on the most critical fixes.

Seamless integration
Push issues directly into your existing DevOps tools like Jira and align remediation tasks with team workflows effortlessly.

Performance benchmarking &
customisable reports
Measure your accessibility performance over time and create role-specific reports to drive continuous improvement.
Why it works
Real-time accessibility
Catch issues before they escalate and reduce later development costs with ongoing monitoring and instant alerts.
Reduce remediation costs
Lower remediation costs and optimise your team resources by resolving the most impactful accessibility barriers, fast.
Performance benchmarking
Measure improvements, track progress, and
calculate ROI from your inclusivity efforts.
Customisable insights reporting
Align efforts and track success
with tailored reports for
every stakeholder.